
Consolidation
Forget copy-pasting numbers from endless spreadsheets at month-end. BrightAnalytics brings your entities together into one clear, consolidated view automatically.

From separate entities to one consolidated view
Before you can consolidate, every intercompany transaction, loan, and receivable between your entities has to match up. That’s usually where month-end stalls. Someone compares balances entity by entity, tracks down the gaps, and books the corrections by hand. BrightAnalytics takes you through it in three steps, from finding intercompany transactions to a clean group result.
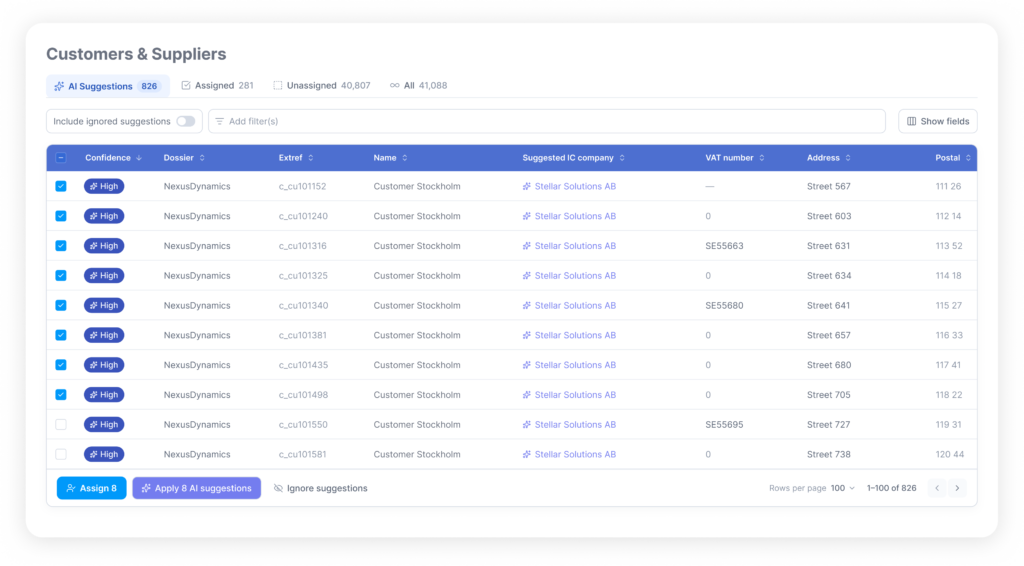
Step 1: Find what’s intercompany
Your entities’ data comes into BrightAnalytics straight from their own accounting packages. Our AI reads through the transactions and flags which ones are intercompany, like your Swedish entity invoicing your Belgian one. Nobody has to tag anything in the source systems first.
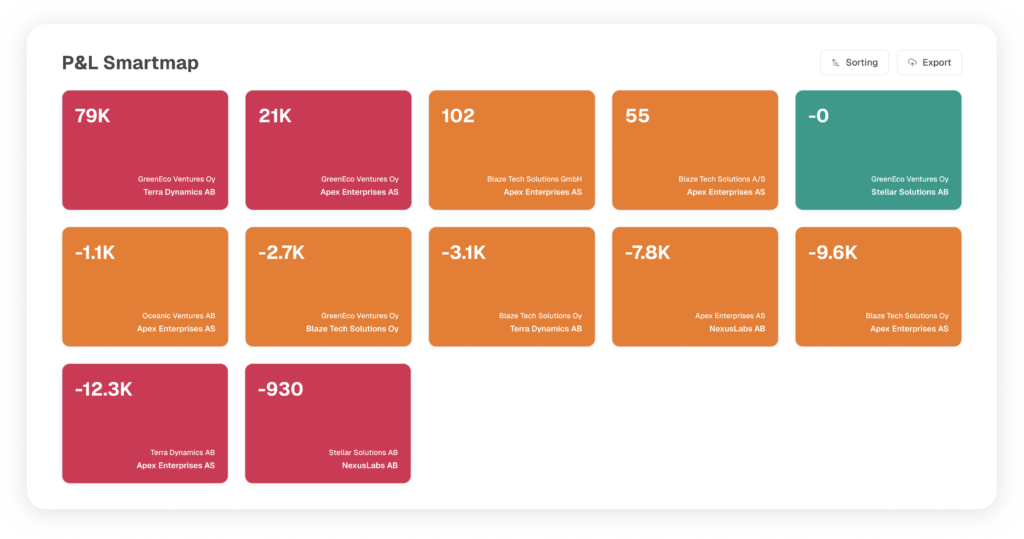
Step 2: See where the numbers don’t match
Every intercompany relationship shows up as a tile on the Smart Map. Green means both sides agree. When a tile isn’t green, drill down to see exactly where the difference is and eliminate balances automatically.
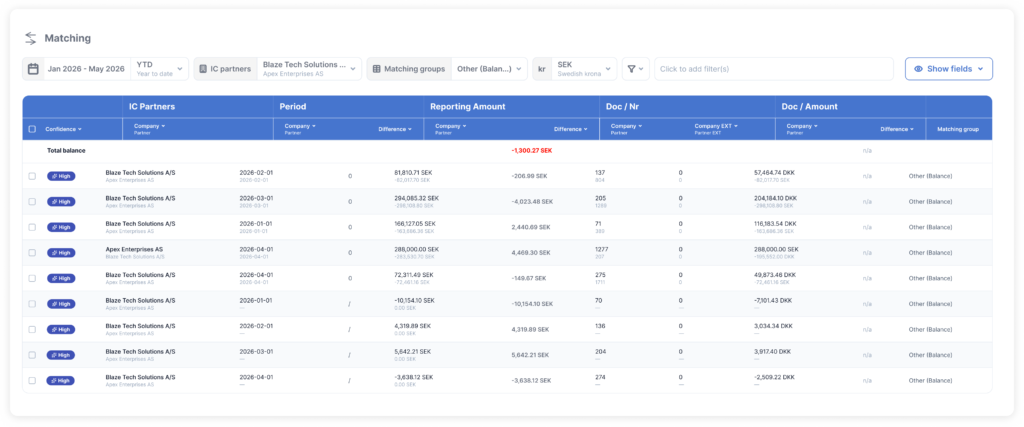
Step 3: Close the gaps and consolidate
Set up matching in the admin panel and BrightAnalytics uses AI to suggest the bookings needed to turn every tile green, each with a score so you know what to approve first. Intercompany transactions are eliminated automatically, and green tiles means your numbers are ready.
Overview
Intercompany is only one part of consolidation. Different entities, accounting packages, currencies, and financial years shouldn’t mean starting from scratch every period. Here’s what else BrightAnalytics handles, in one real-time view of your entire organization.
Acquisition analysis
Track acquisitions, share issuances, stock splits, and dispositions in the shareholder register, with voting and financial rights captured alongside them. Goodwill and non-controlling interests are calculated automatically for each consolidation method.
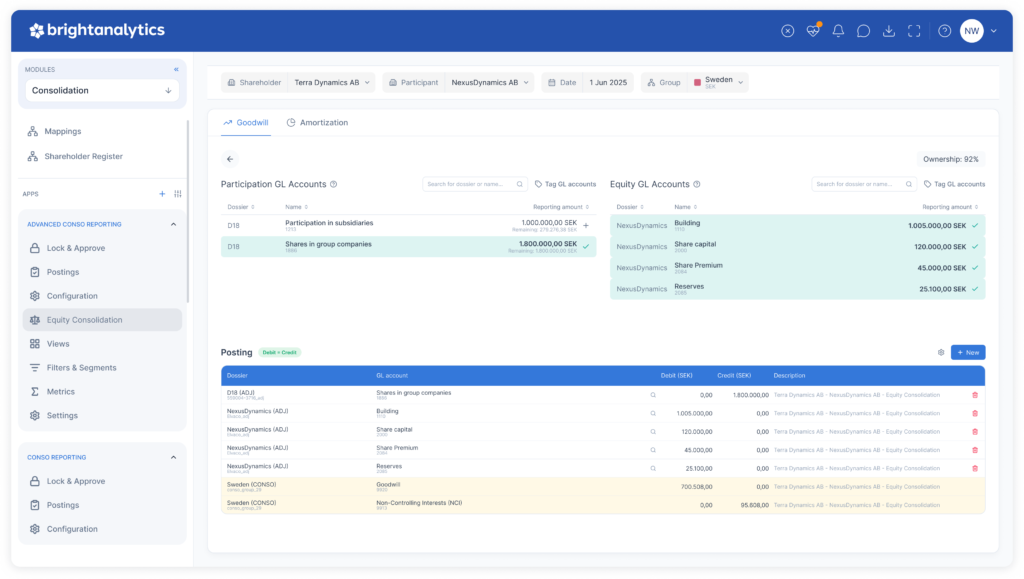
Automated consolidation entries
Post standard consolidation entries and extra-accounting adjustments, such as goodwill amortization, directly within the platform. Adjustments are applied automatically without altering or writing back to your underlying source systems.

Complex structures
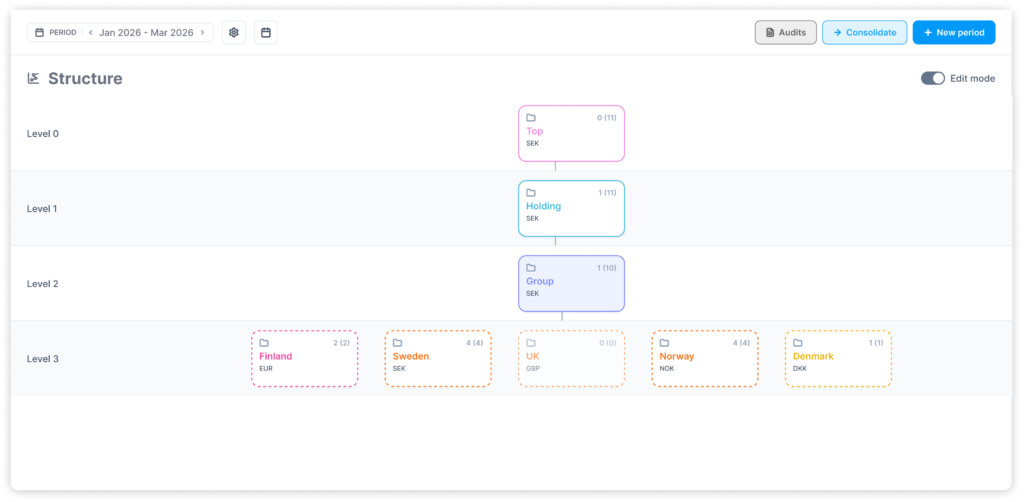
Master group structures with sub-consolidation groups, each company shown at its ownership percentage. Support multiple consolidation circles and customizable intervals, yearly, quarterly, monthly, or year-to-date, so different reporting requirements don’t mean separate tools.
Full control, no consultants
The tool you buy is the tool you use. Mirror your exact group structure and reporting logic yourself, without booking consultancy hours every time something changes. New consolidation group or extra entity? Your finance team sets it up in the platform, with no development work needed.

Security and technology. Bright priorities.
Data security shouldn’t keep you up at night. We protect your numbers every single day through our people, technology, and continuous processes.
- Audit logs track every action, so you always know who changed what.
- Role-based permissions let people see and edit only what’s relevant to their role, down to specific sub-consolidation groups.
- Lock actuals and approve periods so nothing can change in a closed consolidation.
- Our AI features run strictly on internal infrastructure, which means none of your numbers ever go to a third party.
What makes us different


Discover our apps





- Who is BrightAnalytics?
BrightAnalytics is a growing technology company. Our goal is to help companies streamline their management reporting processes.
- What is BrightAnalytics?
BrightAnalytics is the most intuitive, reliable and fast management reporting platform that covers all needs on management reporting and consolidation.
- How does BrightAnalytics work?
- Connect: BrightAnalytics connects with accounting, ERP and CRM systems, and centralises all data in the BrightAnalytics platform.
- Report: The standard templates in BrightAnalytics are immediately ready for use, but can be fully tailored to suit one’s needs.
- Analyse: The management reports and dashboards offer a wealth of information and immediately provide clear insight into the figures of the entire organisation.
- Engage: The clear reports contribute to a better streamlined business strategy and execution, and ensure transparency within the company.
- How do I connect BrightAnalytics to my package?
With our BrightSync we connect to more than 400 data sources. One of the biggest USP’s of the solution is our possibility to connect with every system.